The BMP180 is a new generation digital barometric pressure and temperature sensor from Bosch Sensortec. In this tutorial, we will briefly review this device and describe how to interface it with an Arduino Uno board for measuring the surrounding temperature and pressure. We will also discuss about retrieving the sensor altitude from its pressure readings.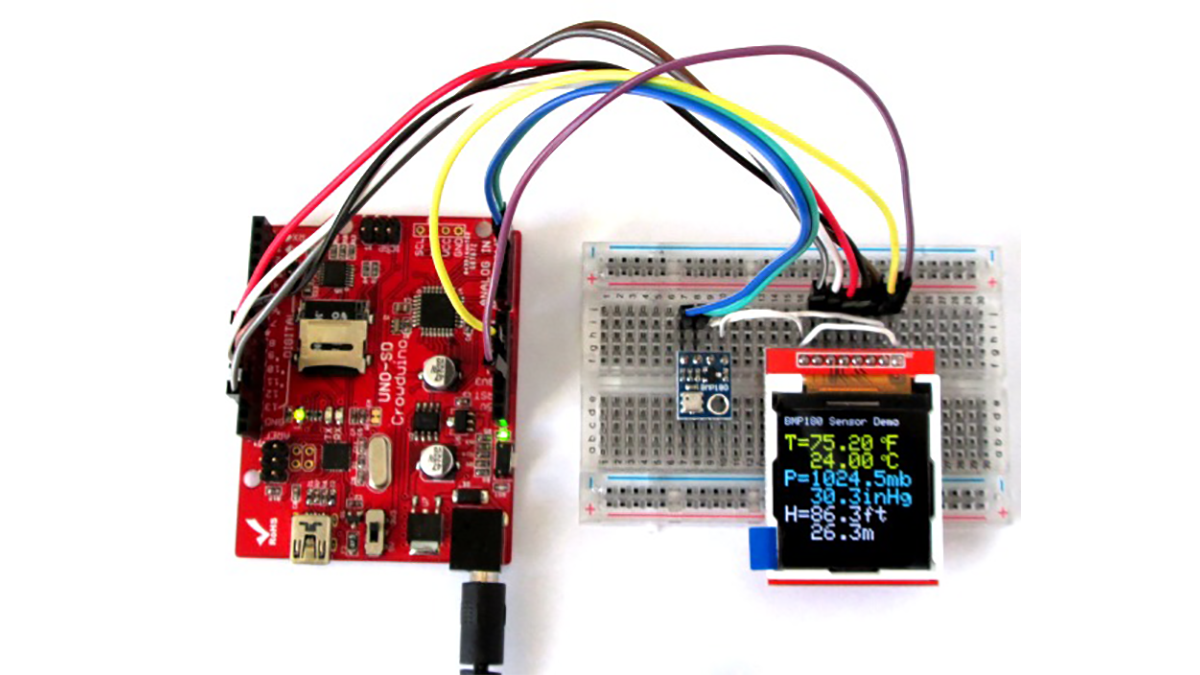
Experiment setup
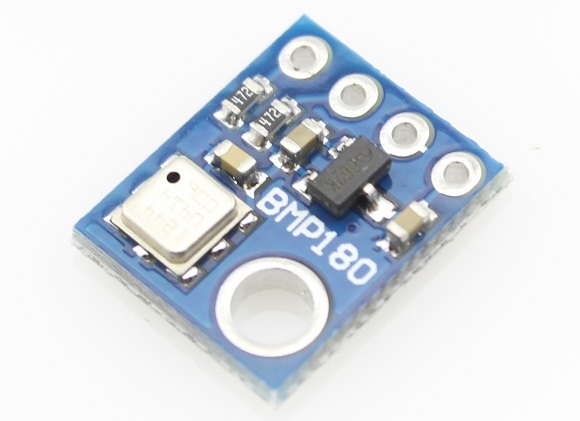
Bosch Sensortag’s BMP180 is an ultra low-power digital temperature and pressure sensor with high accuracy and stability. It consists of a piezo-resistive sensor, an analog to digital converter and a control unit with EEPROM and a serial I2C interface. The raw measurements of pressure and temperature from the BMP180 sensor has to be compensated for temperature effects and other parameters using the calibration data saved into the EEPROM. In this tutorial, we will use an Arduino board to read the temperature and barometric pressure measurements from the BMP180 sensor and display the data on an 1.44″ ILI9163-based TFT display. If you would like to repeat this experiment, you will need the following things.
1. Any Arduino board running at 3.3V. I am using Crowduino Uno board from Elecrow, which has an onboard slide switch to select the operating voltage between 3.3V and 5.0V. If you want to use this board, make sure the switch is slided to 3.3V position.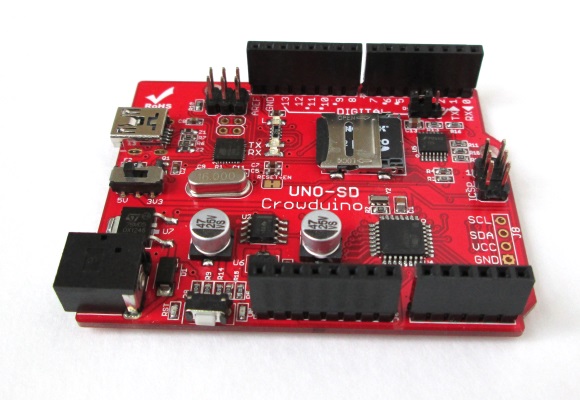
3. ILI9163-based TFT display (I am using one with 1.44″ size display from Elecrow).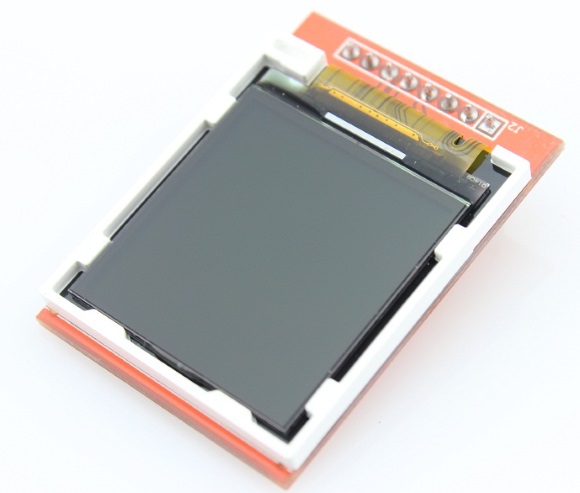
4. A breadboard and few jumper wires for hooking up the sensor and the display to the Arduino board.
The following diagram describes the experimental setup for this tutorial. The BMP180 and the TFT display are both powered by 3.3V. The BMP180 supports I2C interface and therefore the SDA and SCL pins go to A4 and A5 pins of the Arduino board. The ILI9163 TFT driver supports SPI interface. The table shown on the right side of the diagram below describes the wiring between the display and Arduino. The I2C and SPI pin names are printed on the bottom layer silkscreen of the BMP180 and the TFT display modules.
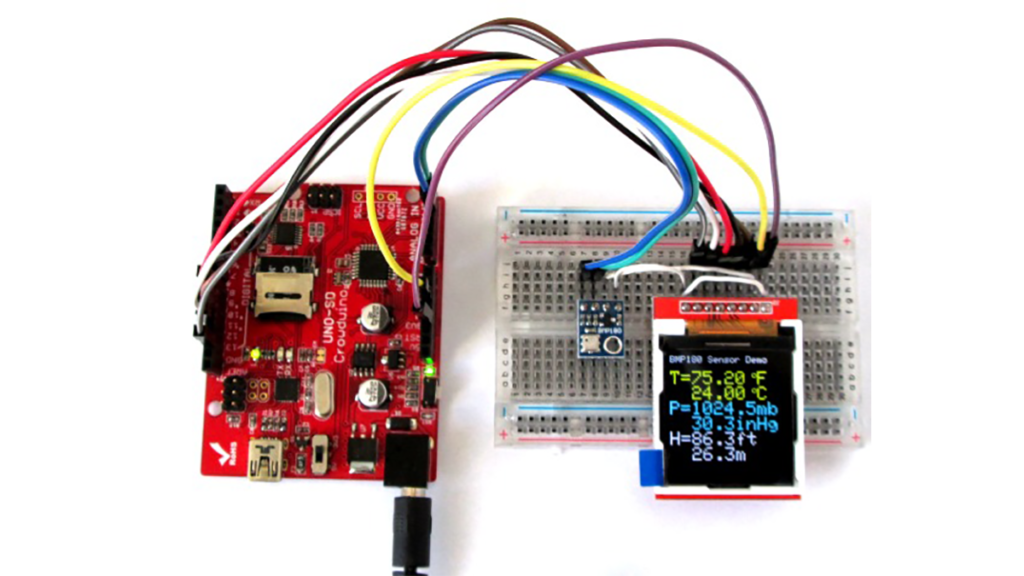
Here is the actual setup for this experiment made on a breadboard.
Arduino firmware
For sensor readings, I am using the BMP180 Arduino Library from Love Electronics Ltd (I am not sure if this company exists now or not bu that’s what it says in the library). You need to download it (link provided below) and install this library into your Arduino/libraries/ location.
For the ILI9163 TFT LCD, I am using another free and open source Arduino Library called TFT_ILI9163C, which you can download from the following link.
Download TFT_ILI9163C Arduino Library
The TFT library uses Adafruit_GFX libraries for fonts, so you need to download and install it too.
After installing both of these libraries, it’s time to write firmware for the Arduino. The firmware I have written and shared below displays temperature in Celsius and Fahrenheit scales and barometric pressure in millibar and inHg. In order to compute the sensor altitude, we need to know the reference surface pressure value as discussed in the following section.
Please note that the BMP180 sensor provides absolute measurements for temperature and pressure, but do not give a direct output for the altitude. Since the atmospheric pressure reduces with altitude, you can find out the vertical displacement of the sensor by knowing the reference pressure value at the ground. For example, in order to compute the sensor altitude, say from the sea level, you need to know the current mean sea level pressure at your local place. The mean sea-level pressure is not a constant and varies diurnally with ambient temperature and weather patterns. An easiest way to find out the current sea-level pressure would be to check the website of your nearest airport or the national weather service. They usually update it on their website hourly or so. I live in Williamsburg, VA and I checked the mean sea-level pressure from Weather.gov website. At the time I was doing this experiment, the mean sea level pressure was 1027.7 millibars or 102770 Pascal. In the Arduino code below (float seaLevelPressure = 102770;), I used this value for the mean sea level pressure and used the difference in the sensor read pressure and this value to compute the altitude of the sensor location, which was the second floor of my house in Williamsburg, VA. Therefore, in order to compute the altitude of your sensor location, you have to replace this value with your current local sea-level pressure value in Pascal (1 millibar = 100 Pascal). With the knowledge of the local sea-level pressure, the Arduino firmware below also displays the altitude above the sea level in feet and meters.Read more: Using BMP180 for temperature, pressure and altitude measurements