
This example shows you how to send a byte of data from the Arduino to a personal computer and graph the result. This is called serial communication because the connection appears to both the Arduino and the computer as a serial port, even though it may actually use a USB cable.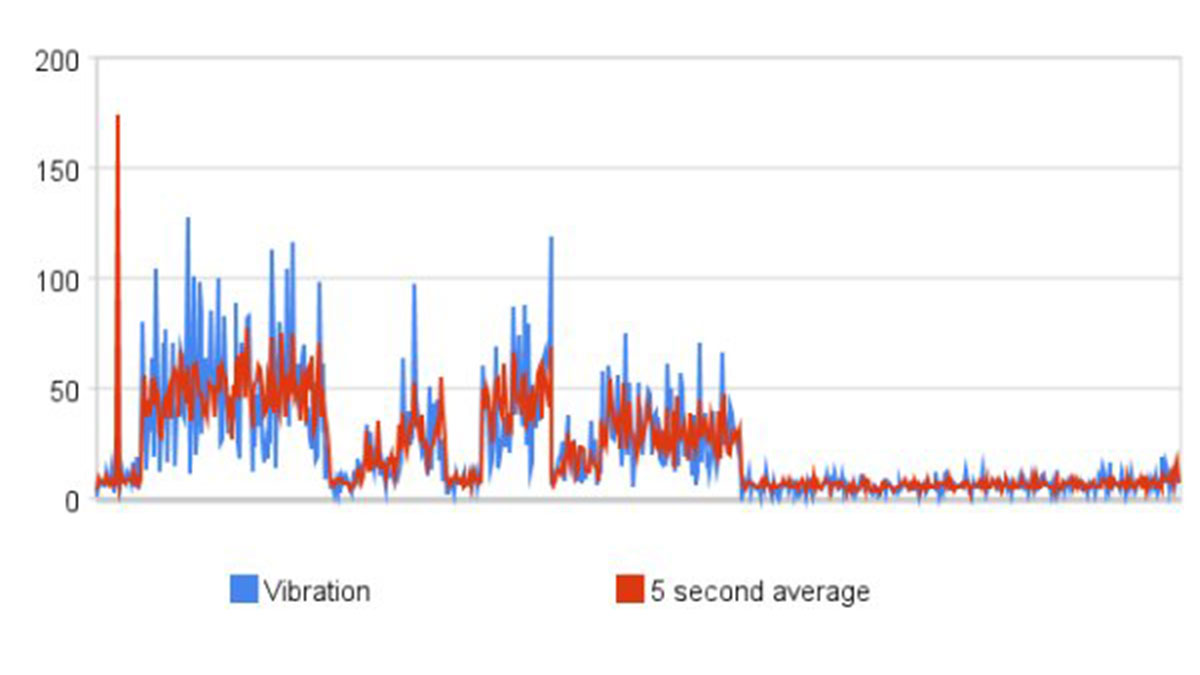
You can use the Arduino serial monitor to view the sent data, or it can be read by Processing (see code below), Flash, PD, Max/MSP, etc.
Software Required
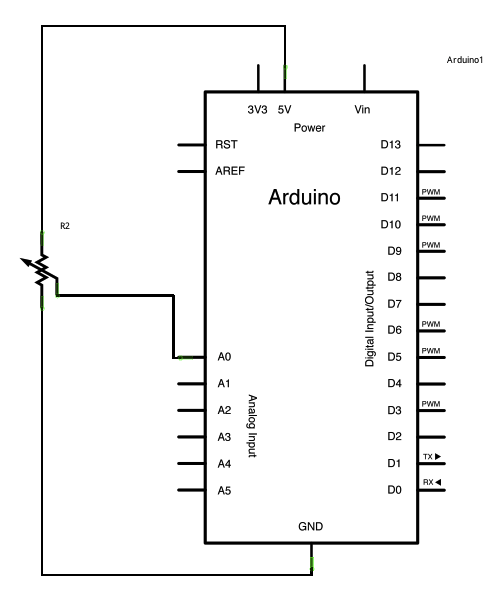
Circuit
Connect a potentiometer or other analog sensor to analog input 0.
image developed using Fritzing. For more circuit examples, see the Fritzing project page
Schematic
Code
Graph
A simple example of communication from the Arduino board to the computer:
the value of analog input 0 is sent out the serial port. We call this “serial”
communication because the connection appears to both the Arduino and the
computer as a serial port, even though it may actually use
a USB cable. Bytes are sent one after another (serially) from the Arduino
to the computer.
You can use the Arduino serial monitor to view the sent data, or it can
be read by Processing, PD, Max/MSP, or any other program capable of reading
data from a serial port. The Processing code below graphs the data received
so you can see the value of the analog input changing over time.
The circuit:
Any analog input sensor is attached to analog in pin 0.
created 2006
by David A. Mellis
modified 9 Apr 2012
by Tom Igoe and Scott Fitzgerald
This example code is in the public domain.
http://www.arduino.cc/en/Tutorial/Graph
*/
void setup() {
// initialize the serial communication:
Serial.begin(9600);
}
void loop() {
// send the value of analog input 0:
Serial.println(analogRead(A0));
// wait a bit for the analog-to-digital converter
// to stabilize after the last reading:
delay(2);
}
Processing Sketch
Using the Processing sketch in the code sample above, you’ll get a graph of the sensor’s value. As you change the value of the analog sensor, you’ll get a graph something like this: