Once you’re getting some values from sensors, for example using Arduino, (see my previous instructable), sometimes it’s nice to see the sensor data in a graph.
Here’s how in only a few steps!
I made this particular Instructables using a sonar sensor (XL Max Sonar EZ/AE) but you can do it with any data values that are separated in arduino by a carriage return and a line break:
To put it simply, the incoming sensor data should look like this in the Arduino Serial Monitor:
23
23
24
24
25
22
26
Separated by a newLine.
I made it at TechShop. !
www.techshop.ws
Step 1: Get CoolTerm
Download it at : http://www.macupdate.com/app/mac/31352/coolterm.
Open CoolTerm.
Step 2: CoolTerm and the Arduino code
Serial.println(potValue); //print the sensor value to the debugger panel
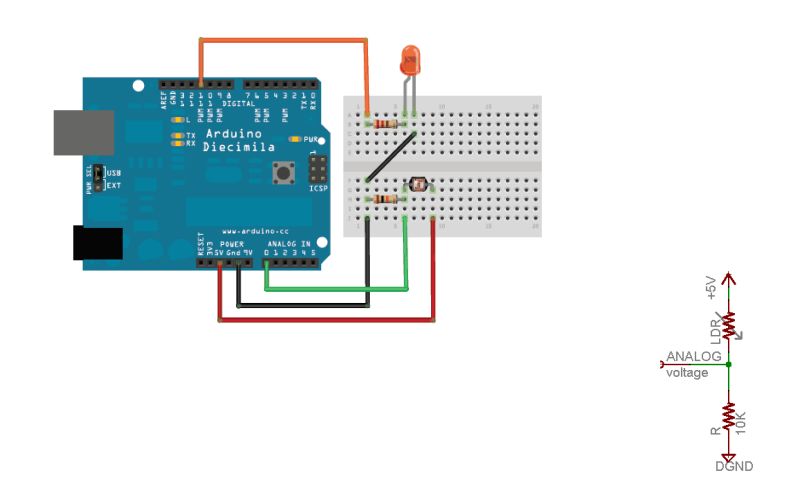
Any code for one sensor would work, for instance the attached circuit and code would work for a photocell to measure light levels.
Instead of the photocell I’m using the Max Sonar Sensor to measure proximity.
Step 3: Connecting to the Serial Port in CoolTerm
Make sure the Baud Rate is set to 9600 (because remember in Arduino, we set it to 9600 using Serial.begin(9600);
NOTE: You cannot have two Serial ports open at the same time, so you cannot view the arduino serial monitor while you are using CoolTerm.
Step 4: Start Recording & Saving
You should see data scrolling through in the serial monitor.
Begin to record the data:
Click Connection –> Capture to Text File –> Start
You can specify where to save the text file.
Step 5: Graph the Data
Your sensor data should look something like the image – a long columns of numbers.
See the images for the following:
Click on “Chart”.
Then click “Line”.
and click on “Line” again.
(see the images)